Production Incident Cost Models for Early-Stage Startups
A fuller cost model counts the hidden losses that outlast downtime.
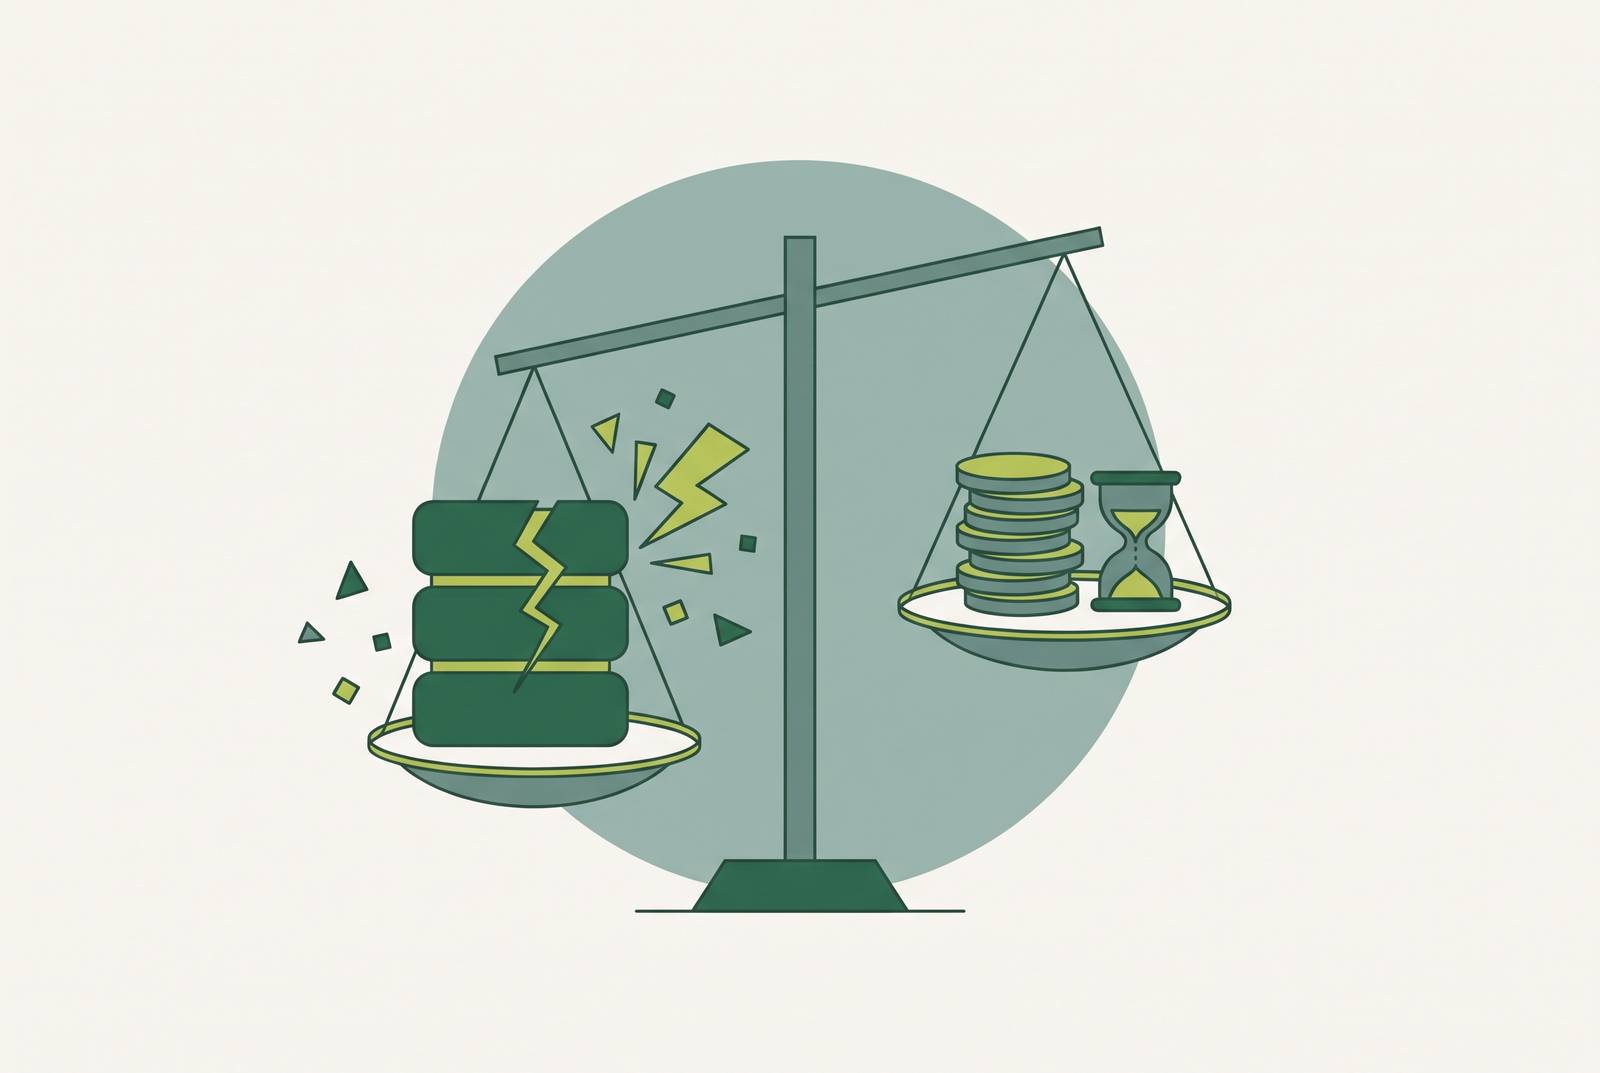
Production incident cost models for early-stage startups need to count engineering time, lost business, support work, delayed progress, and downtime revenue. Before hiring an engineering partner, a technical debt assessment should connect architecture, test coverage, documentation, and data portability to those costs. That gives founders a basis for comparing reliability work with the full cost of leaving weaknesses in place.
Why production incidents cost early-stage startups far more than the downtime itself
During an outage, a founder stares at a monitoring dashboard and watches the revenue counter. Failed transactions offer a visible measure of the damage, and restoring service gives that measure an apparent endpoint. The dashboard makes the loss look bounded. Yet service recovery does not mean the business has recovered, because customers and the team may still be dealing with the consequences.
This creates a blind spot in budgeting. If a founder compares the price of prevention only with transactions lost during downtime, reliability work can look more expensive than the failure it prevents. What happens when that comparison leaves out most of the exposure? The team underinvests because it has priced the risk incorrectly.
How the four cost layers of a production incident add up for a small team
The first layer is engineering time spent diagnosing, fixing, and communicating the incident. For a small team, this is typically the largest single line item. Recovery also extends beyond the immediate response. An engineer handling a late-night P1 incident does not return to full productive capacity the next morning, and repeated interruptions can compound into burnout and turnover.
The second layer is lost revenue and signups, which includes failed transactions and prospects who see an error page and never come back. Some losses are easy to count. Others remain invisible because the team cannot see the business that would have happened without the failure. This makes even the most familiar part of the model less complete than it appears.
The third layer is support overhead from inbound tickets, refund requests, and status communications. This work consumes non-engineering time that incident accounting often overlooks. It does not end when the fix ships. Customers still need answers, and the people providing them have less time for their usual work.
The fourth layer is opportunity cost from features, sales calls, and growth experiments that have been put off. For an early-stage company, this can be the most consequential layer because it delays learning about product-market fit. The distinction needs care when estimating costs. Response time belongs in the engineering or support budget, while opportunity cost describes what the diverted effort would otherwise have achieved.
Fintech failures can leave a company open to regulatory action, healthcare bugs can lead to liability for harm to patient safety, and e-commerce failures can cause cart abandonment that scripted regression testing could have prevented. Outages that last the same amount of time can lead to different losses. The affected workflow determines how much harm a failure can cause.
Why the same incident costs more when the underlying code is structurally fragile
A working prototype is not necessarily a diagnosable production system. AI-coding tools and rapidly assembled MVPs can shorten the path to launch while leaving gaps in modularity, test coverage, and documented structure. Those gaps become expensive during a failure. When the team struggles to understand the affected code or test a repair, the same outage takes longer to resolve.
NIST found that defects caught in production cost dramatically more to fix than defects caught during development. As the codebase grows on its original foundation, the gap grows with it. Technical debt also consumes engineering time between incidents. That leaves less capacity for prevention, feature work, and the refactoring that could reduce future failures.
Before signing with an outside development team, a founder therefore needs more than a judgement that the code runs. The assessment should cover architectural structure, modularity, test coverage, documentation, recurring incidents, and data dependencies. An example deliverable is a scored register that links each weakness to its likely incident consequences and the work proposed to address it.
Such an assessment distinguishes a local defect from a foundation that repeatedly generates expensive failures. It also makes debt servicing visible as an operating cost that slows delivery. Without that distinction, the cycle reinforces itself. Debt increases incidents, incidents slow the team, and the slower team has less time to reduce the debt behind the next failure.
The costs that arrive weeks or months after the incident closes
Some of the largest losses arrive after the response is over. A customer may tolerate an outage and cancel at renewal, leave a negative review during a competitor evaluation, or stop expanding usage. None requires an immediate complaint or cancellation. The resulting loss appears in retention or growth metrics, separated from the event that helped cause it.
In B2B markets, those later losses can also come from would-be customers. Concerns about reliability spread through Slack communities, talks at conferences, and calls to assess vendors, which can shut a startup out of deals it never knew existed. Active deals can slow as well. Enterprise and mid-market buyers conducting technical due diligence may use a pattern of outages to renegotiate, delay a decision, or walk away.
When coordination leaves no audit trail, compliance-sensitive buyers and investors cannot reconstruct what happened. The gap can suggest operational immaturity. Series A and B investors increasingly include technical due diligence, and findings such as architectural debt or low test coverage can affect valuation, deal structure, or completion.
AI agents with unconstrained production credentials create a particularly acute category of risk. If an agent causes irreversible data loss, legal exposure, lost trust, and compliance consequences may take months to emerge. A prompt is not a security boundary. Credential scope must be enforced technically rather than left to conversational instructions, because the cost model must include what an agent is permitted to damage.
What a realistic reliability investment actually buys at early-stage scale
Could the business survive 48 hours of downtime during its busiest month? If not, QA is a form of continuity insurance. Its value comes from cutting costly failures, with no promise to get rid of every bug.
The notes’ QA categories distinguish Tier 1 revenue blockers such as checkout failures and login loops, Tier 2 customer experience damage, and Tier 3 security vulnerabilities. These categories help connect testing to consequences. A useful comparison sets the cost of prevention against the incident exposure of the affected workflow. Comparing QA tooling prices alone misses the reason for buying the tools.
Once a team has five to ten engineers who handle incidents every month, it also needs to weigh the cost of coordinating their work. Ad-hoc Slack response can consume more time than problem-solving. Runframe offers on-call scheduling, escalation policies, Slack integration, and postmortem drafting on a free plan, with paid tiers starting at $12/user/month annual. It launched in 2026 and is aimed at teams of ten to two hundred engineers moving toward documented, pageable response.
incident.io brings on-call scheduling, incident response coordination, status pages, and AI-powered post-mortems together in Slack and Microsoft Teams. Its Team plan costs $310/month for a ten-person team, with setup taking one to two days. Atlassian is sunsetting Opsgenie by April 5, 2027, so teams using it also need to account for migration.
Reliability spending consumes runway before the product thesis is validated, and an elaborate process can exceed current needs. The investment level should scale with user exposure. Building a sound foundation is less expensive than rescue engineering later, but that does not make every available reliability feature an immediate requirement.
Why nonprofits face the same incident cost model with less margin for error
Nonprofits face the same cost layers but have less money to fall back on. A broken donor flow or lost critical data can reduce the budget available for the mission and damage relationships built over years. Donor retention is revenue. Operational failure therefore threatens the organization’s capacity to do its work and its plans to expand.
Changes to terms, discontinued features, or the end of free tiers can force transitions that the organization has little capacity to manage. Custom software needs more than account and device support. It needs code ownership, upgrade paths, a response to integration failures, and clear escalation procedures that volunteer developers or one-time grantors rarely provide.
The Nonprofit Open Source Partnership 2026 brings together Bloomberg, Develop for Good, CodeDay, and Fast Forward to help selected nonprofits get their software ready for open-source use. That addresses a real part of the build burden. It does not, by itself, close the ongoing maintenance and incident management gap. The distinction belongs in the cost model because obtaining software and keeping it dependable are different commitments.
How the data tooling decision at MVP stage shapes future incident risk
Airtable and similar no-code tools lower the barrier to shipping, but migration, licensing changes, and scaling failures can expose costs that were not visible at launch. The initial convenience is only one input. Reliability depends on whether the team can export its data, own its schema, and migrate without depending on a vendor’s cooperation.
Baserow’s repository says it is an open-core product whose non-premium and non-enterprise features are under the MIT License. Premium and enterprise features have separate commercial licenses. Teams that want control over deployment can use its self-hosting and simple Docker deployment. That control addresses vendor dependency, but the license distinction remains part of the assessment.
NocoDB converts existing SQL databases into a visual no-code workspace. Its documentation states that it shifted in January 2026 from AGPL-3.0 to a source-available Sustainable Use License based on Fair-Code principles. It is not open source approved by an open-source standards body. The license permits internal business use but not offering it as a managed service to third parties, making intended use an essential selection criterion.
Stackby combines spreadsheet, database, and workflow automation interfaces for teams seeking a no-code working environment. Grist supports relational data modeling and Python formulas, while Teable is Postgres-backed and relevant when performance at scale is a starting requirement. These tools address different needs. The comparison depends on who will use the system and what control the product requires.
SeaTable, from SeaTable GmbH in Mainz, Germany, offers servers in Frankfurt and Munich and self-hosting options for organizations needing a contractual EU data partner for GDPR requirements. Supabase is developer-first and Postgres-backed. It is closer to Firebase or AWS Amplify than a no-code database. Those differences shape both who can operate the platform and which dependencies the team accepts.
A change in permitted use can constrain the team when it needs to adapt. Portability cannot be inferred from a familiar interface. Open-source and self-hostable options can reduce dependence, while hosted tools make the answer conditional on the control and export options available.
Building a cost model that accounts for all the layers, not just the dashboard
A useful cost model separates the losses a team can record from the exposure it must estimate. Engineering and support time go alongside lost transactions, while the team needs to track separately which work was put off. Churn and the effects of an incident on sales can take longer to become measurable. Architecture and data dependencies then explain why some failures are more likely, harder to repair, or more difficult to escape.
For a founder assessing an engineering partner, this changes what a proposal needs to explain. A scored register of technical weaknesses becomes useful when it connects assessment findings to incident frequency, recovery effort, customer exposure, and portability. A score alone cannot establish investment value. The proposed work needs a clear relationship to the costs it is intended to reduce.
Timing also changes the available choices. Repair becomes harder after new engineers absorb existing debt patterns, more code grows on a fragile foundation, or a licensing constraint narrows migration options. The signal need not be a catastrophic outage. Recurring incidents, slowing features, and persistent firefighting are enough to ask which path will support real users without compounding the problem.